Sure! Here’s a well-structured and engaging blog post that explains your GitHub project, focusing on integrating force-graph-3d into a Next.js project. The tone is informative and approachable — suitable for developers interested in 3D visualization or knowledge graphs.
Integrating force-graph-3d into a Next.js Project: A Simple Demo
If you’re exploring ways to visualize knowledge graphs or network data in 3D using React and Next.js, you’ve probably come across the popular library force-graph by @vasturiano. In this post, I’ll walk through how I integrated force-graph-3d — its WebGL-based 3D force-directed graph implementation — into a Next.js app as part of my ongoing Knowledge Graph + LLM project.
You can check out the full code here:
👉 GitHub - Knowledge_Graph_X_LLM / graph-visualization
⚠️ Note: This is more of a proof-of-concept/demo than a production-ready solution. There’s still work to be done before this can scale to large or complex graphs, but it’s a solid starting point!
🎯 Why Use force-graph-3d?
force-graph-3d offers an interactive and performant way to render large-scale 3D graphs directly in the browser using WebGL. It supports:
- Dynamic force simulation
- Custom node/camera controls
- Real-time updates
- Click/touch interactions
Since I’m working on visualizing knowledge graphs generated via LLMs, having a 3D layout helps users better understand relationships and hierarchies in a visually rich format.
🛠️ Setting Up the Next.js Environment
I started with a basic create-next-app setup:
| |
Then installed the required dependencies:
| |
💡
force-graph-3drelies on Three.js, so make sure it’s included (either directly or as a peer dependency).
📐 Creating the Graph Component
I created a new component called Graph3D.tsx (or .jsx) and imported ForceGraph3D from force-graph-3d.
Here’s a simplified version of the component:
| |
This will render a simple 3D force-directed graph inside a div.
🧪 Running the App
After creating the component, I imported and rendered it in the main page (pages/index.tsx):
| |
Now run the dev server:
| |
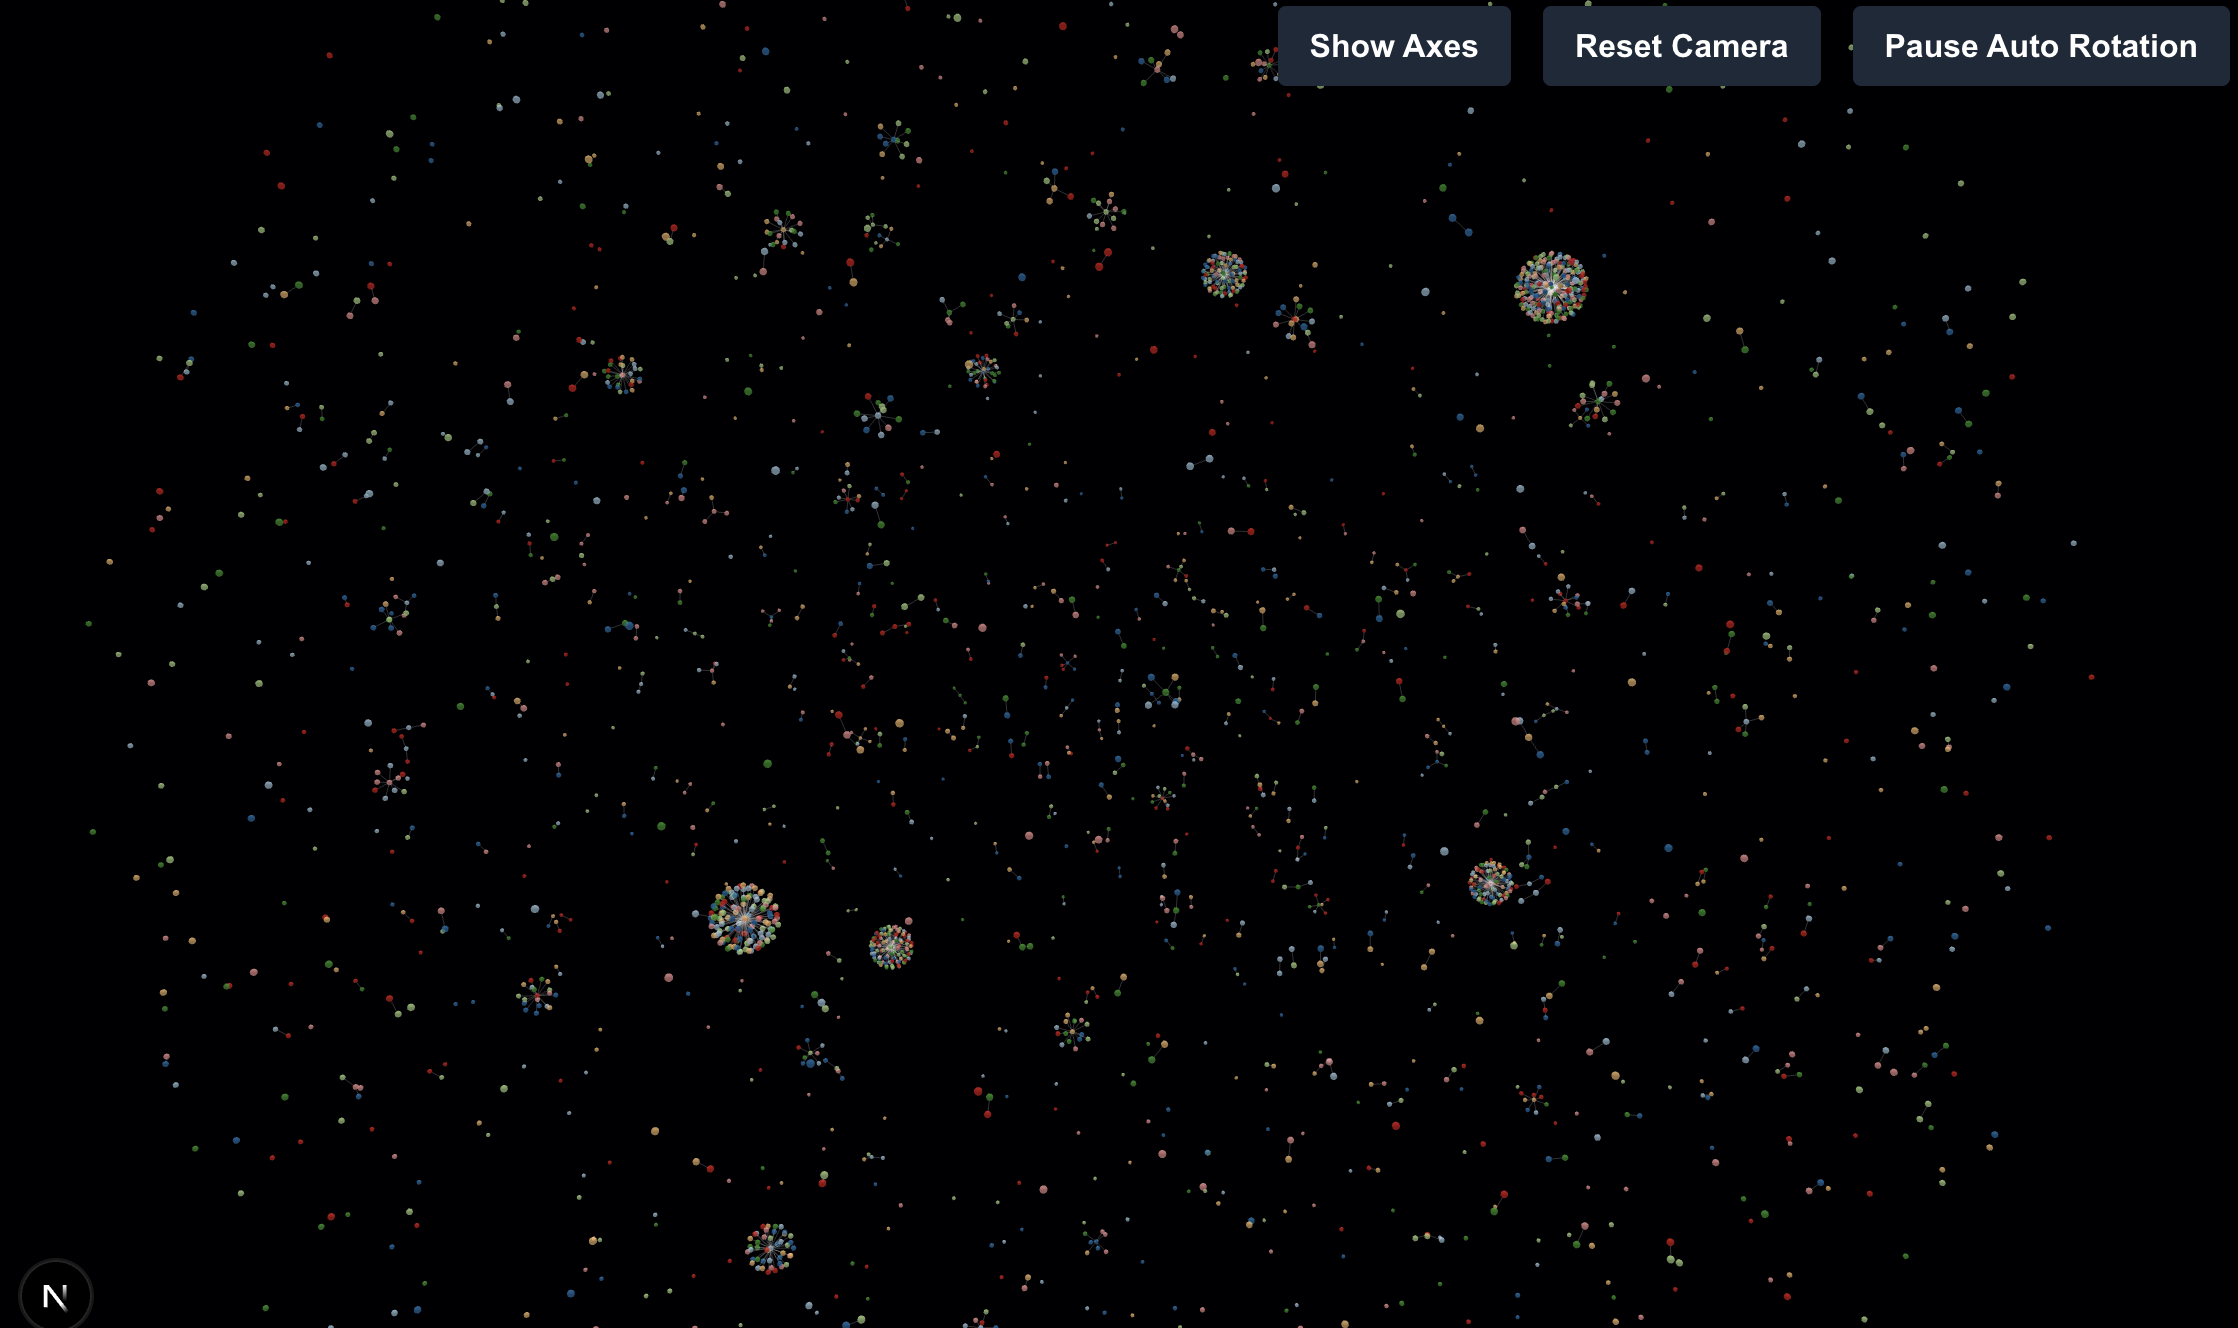
Visit http://localhost:3000, and you should see an interactive 3D graph spinning in space!
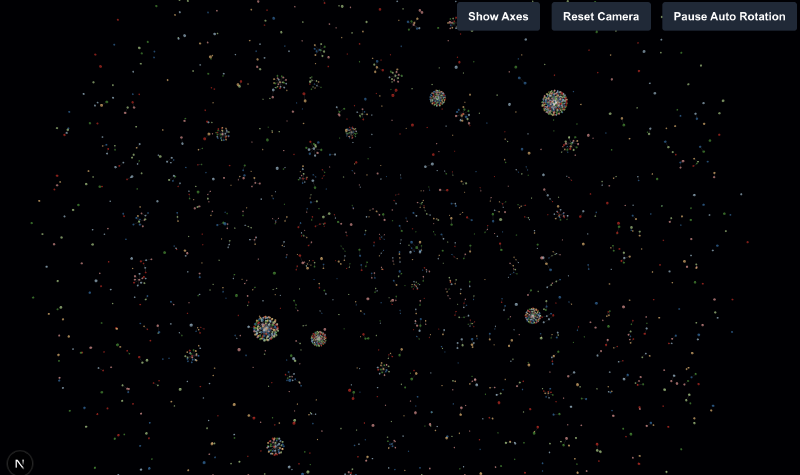
📷 Exapmple screenshot:

🧩 Challenges and Considerations
1. Hydration Issues in Next.js
Because force-graph-3d creates DOM elements outside of React, you might run into hydration mismatches when using SSR. To avoid this, I conditionally render the graph only after mounting on the client side.
2. Performance & Scalability
Rendering hundreds or thousands of nodes can get heavy quickly. Optimization techniques like throttling force simulation steps or limiting node rendering radius may be necessary.
3. TypeScript Support
The current example uses JavaScript, but if you’re using TypeScript, you’ll need to define types for nodes and links manually or use declaration files.
🌱 What’s Next?
This demo serves as a foundation for building more advanced visualizations. Some ideas for future improvements include:
- Connecting the graph to real LLM-generated knowledge triples
- Adding tooltip support on hover
- Enhancing styling with labels, colors, and icons
- Supporting zoom/pan interaction customization
- Improving accessibility and responsiveness
🧾 Conclusion
Integrating force-graph-3d into a Next.js project isn’t too difficult once you navigate around some SSR quirks. With just a few lines of code, you can start rendering beautiful and interactive 3D graphs right in your React application.
As part of my larger Knowledge Graph + LLM project, this visualization layer opens up exciting possibilities for understanding and navigating complex semantic relationships.
Let me know if you try this out or have suggestions for improvements!
🔗 Links
- 📦 GitHub Repo: https://github.com/gwzz/Knowledge_Graph_X_LLM/tree/main/visulization/graph-visualization
- 📚
force-graph-3d: https://github.com/vasturiano/force-graph - 🚀 Next.js Docs: https://nextjs.org/docs
